![people element logooo.png]](https://20709424.hs-sites-na2.com/hs-fs/hubfs/people%20element%20logooo.png?height=50&name=people%20element%20logooo.png)
How We Prioritize Our Roadmap
Our product roadmap evolves with the needs of our clients, with a continued focus on keeping People Element easy to use and helping clients move from insights to action faster. We continuously gather feedback and platform experience data to understand where improvements can have the greatest impact. When evaluating new features and enhancements, we consider the scope of the work, how many clients will benefit, and how meaningfully the change will improve their experience. While we make larger roadmap decisions quarterly, we continually reassess and adjust priorities as needs evolve—always focused on delivering the most meaningful impact across our clients.
Meet Analyst Insight (Ai)
August 2026
Meet Analyst Insight (Ai)—your always-on analyst, built into People Element. It turns multiple survey signals into one clear story about what's happening and where to focus, so you spend less time in reports and chart analysis, and more time acting on what matters.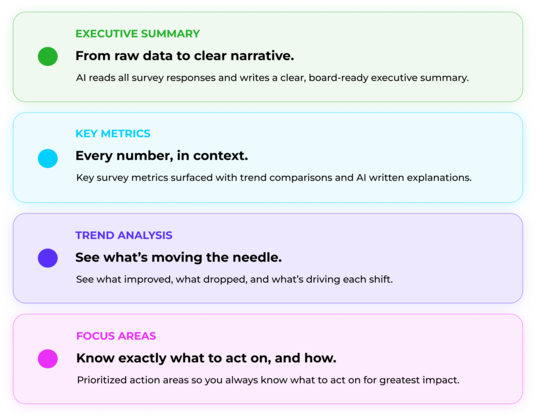
Improved Historical Data Imports for a Smoother Transition to People Element
July 2026
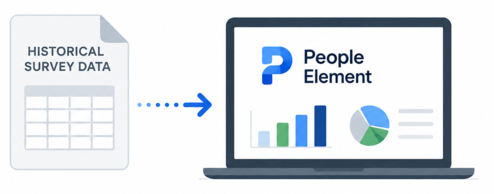
We’ve improved the way historical survey data is brought into People Element when organizations transition from another survey platform. Our enhanced data import process allows our team to more efficiently import historical survey results when data is available in a supported format.
Historical survey data provides valuable context for understanding how employee feedback and key metrics have changed over time. This enhancement streamlines the import process behind the scenes, helping organizations joining People Element preserve that history while reducing the time and effort required to transition eligible data from another platform.
Flexible Survey Scoring with Reverse Coding
June 2026
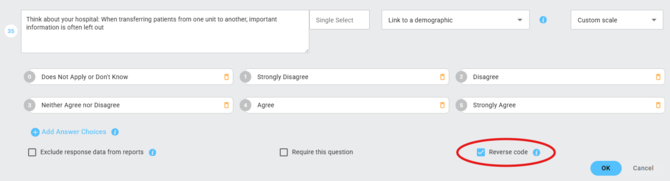
Some surveys like AHRQ's Surveys on Patient Safety Culture (SOPS), mix positively and negatively worded questions on purpose. For scores to add up correctly, the negatively worded questions need to be "reverse coded" so they point in the same direction as the rest.
Survey administrators can now turn on Reverse Coding for individual questions right in the Survey Builder. Once enabled, responses are automatically flipped (for example, a 1 becomes a 5 and a 5 becomes a 1), so your reports and scores accurately reflect what respondents meant. Reverse Coding is uncommon and meant for specific survey methodologies like AHRQ SOPS, so use it only when your survey calls for it.
Automatic eNPS Demographics - Helping you quickly breakout your data without manual effort
May 2026
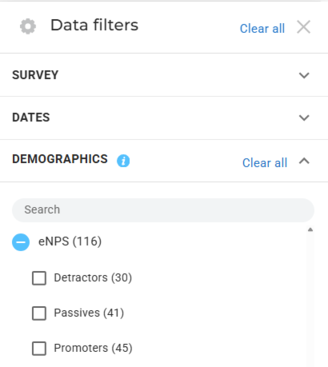
We've simplified eNPS reporting by automatically creating an eNPS demographic whenever you use one of People Element’s two eNPS library questions in your survey.
The Employee Net Promotor Score demographic is immediately available as a reporting filter, allowing you to instantly filter and slice your survey results by Promoters, Passives, and Detractors. It also appears in the Automated Demographics section, eliminating the need for manual setup or demographic linking. If you don't need it, it can be disabled at any time from the Demographics page.
Smarter AI Models for Deeper Insights and Improved Risk Detection
March 2026
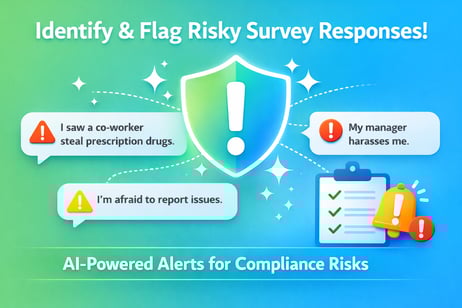
We upgraded the AI models powering AI Comments and Risk Insight, improving the clarity, depth, and accuracy of insights. These enhancements enable more meaningful summaries and better detection of sensitive or complex concerns, helping organizations respond with greater confidence.
Introducing Risk Insight: Advanced AI-Powered Risk & Compliance Monitoring
January 2026
We introduced Risk Insight, an evolution of our Red Flags feature into a more comprehensive Risk & Compliance solution. Powered by enhanced AI monitoring, Risk Insight automatically identifies open-ended survey responses that may indicate concerning, inappropriate, or high-risk situations requiring attention. Organizations can also customize keyword tracking to highlight topics most relevant to their needs, while continuing to leverage compliance reporting tied to specific questions and responses. This upgrade provides deeper visibility into potential risks and helps teams respond more proactively.
Targeted Survey Delivery with Flexible Contact Preferences
December 2025
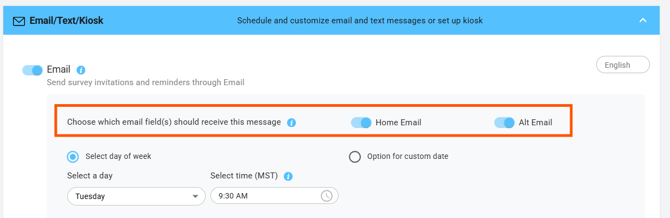
Survey administrators now have greater control over how invitations are delivered with the ability to designate specific contact methods for each survey. Whether sending engagement surveys to work emails or directing exit surveys to personal email addresses or phone numbers, this feature ensures that communications are more targeted and appropriate for the audience. The result is improved delivery accuracy, better response rates, and a more seamless experience for both administrators and participants.
Enhanced Summary Insights with Favorability Breakouts
November 2025
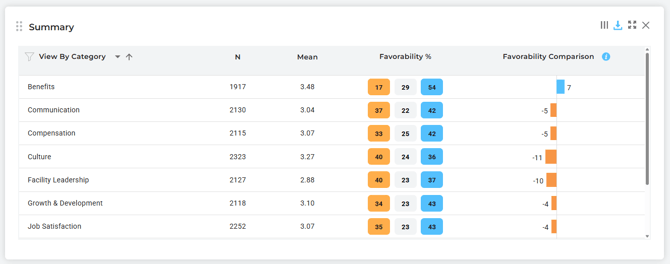
We enhanced the Summary Chart by introducing favorability breakouts, giving users a more complete view of their data through favorable, neutral, and unfavorable score distributions. This update allows teams to quickly identify not only areas of strength but also low-scoring items that may require attention.
Explore Comments with Keyword Search
October 2025
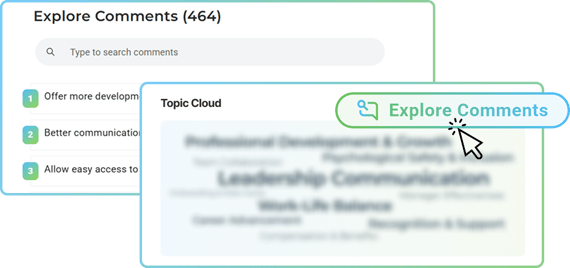
The new Comment Explorer makes it easier to find and understand open-ended feedback. You can now search for specific keywords or phrases within comments, either across all topics or within a single topic. This update helps you quickly locate relevant responses and uncover themes without manually reading through every comment.
Survey Branching Logic - Route Your Participants Through Your Survey
September 2025
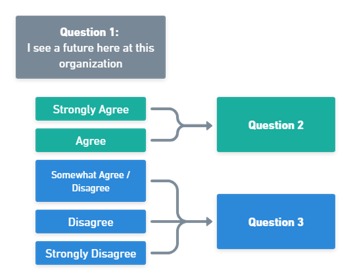
We’re excited to introduce Survey Branching Logic — a powerful new way to create smarter, more personalized surveys! With branching, you can guide participants down different paths based on their answers — jumping to key questions, hiding irrelevant ones, or ending surveys early when appropriate. This update makes surveys more engaging, efficient, and tailored to every participant’s experience.
Easier way to share your ideas: The new Feedback Button
August 2025
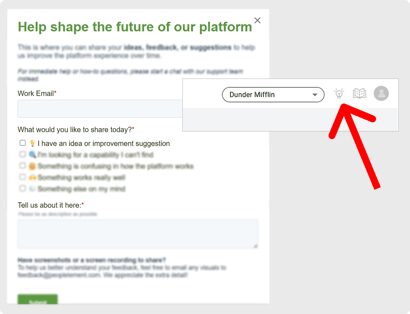
We’ve added a new Give Feedback feature to make it easier for you to share your ideas and suggestions about the platform. You’ll now see a lightbulb icon in the top right corner of your screen, which opens a feedback form where you can tell us what’s working well and where we can improve. This feature was added to provide a simple and consistent way to share feedback that helps guide future platform improvements. For more details on how to use the new feature, check out our knowledge base article Leave Your Feedback for the People Element Platform.
New & Improved Comment Analysis with AI Summaries
July 2025
This release introduces major enhancements to Comment Analytics, including AI-powered summaries of open-ended feedback, dynamic topic detection with AI-generated topic summaries, an interactive topic cloud, and sentiment scoring to quickly gauge overall tone. These updates leverage a new large language model using GPT Open AI and advanced natural language processing, delivering faster, more accurate insights for easier analysis and sharing.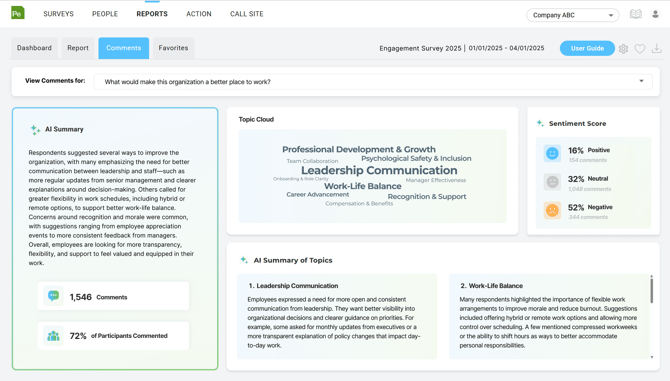
Share Action Plans with others under the same Data Level or Survey Level Access
June 2025
With this update, platform users who share the exact same data-level or survey-level access within their organization can now view each other’s action plans. For example, if a user has access to Department A at Location B, any other user with that same access will be able to view their action plans—and vice versa. This is a one-to-one relationship: only users with identical access levels can see each other’s plans. Access remains view-only; users cannot edit or modify plans created by others. Client admins with full platform access will continue to have visibility into all action plans across the organization.
Export Matrix and Engagement Charts Directly to Excel
May 2025
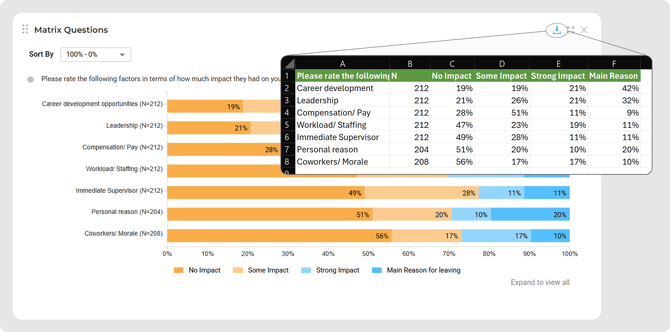
Users can now export Matrix and Engagement charts directly to Excel with a single click. Located in the top right corner of the chart is a download button. With one click an export will be downloaded directly to your browser.
This new functionality supports deeper analysis and easier sharing of insights with your team. Each export delivers a clean, well-formatted Excel file that’s immediately ready for use offline.
Performance Enhancements: Faster Report Loading and Data Imports
April 2025
We’re excited to announce the release of major performance upgrades across the platform, delivering a significantly faster and more efficient user experience.
Effective April 7, 2025 users will notice dramatic speed improvements in key areas, including report loading, PDF and PowerPoint exports, and census file imports.
These optimizations mean less time waiting—and more time analyzing, presenting, and acting on your data.
Raw Data Automation to Internal Systems
March 2025
If you import Raw Data exports from People Element into internal systems like an HRIS or BI tool, manual work is no longer needed. Our new Raw Data Automation feature securely connects survey data to your systems with automated, scheduled transfers.
Perfect for ongoing surveys like Exit or New Hire, or for consolidating vendor data into custom dashboards. Easily schedule automatic transfers of raw data files to an SFTP server at your preferred time. To set it up, contact your People Element representative.

Custom Report Builder
February 2025
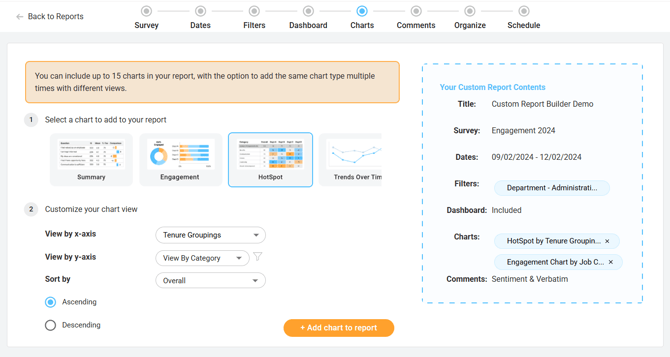
The Custom Report Builder is here—giving you full flexibility to create reports tailored to your needs by combining all report features in one place. It’s easy to use, with familiar tools like filters, sorting, and customizable chart views.
Add sentiment analysis and raw comments (if included in your access), save your report, or schedule it to send automatically via email. Reports are available in PDF or PowerPoint for easy sharing. To read more about the Custom Report Builder, click here or to watch our interactive demo, click here.
Dropdown Questions in Reporting
January 2025
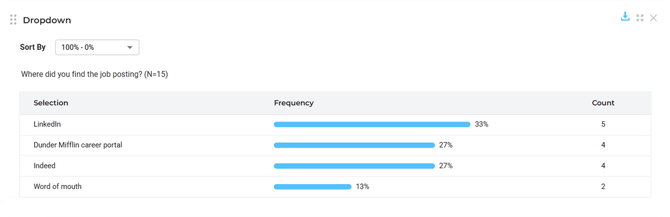
We’re excited to introduce the Drop Down Reporting Chart—now available on your reports page for easier analysis of drop-down question data.
You can visualize response frequencies, filter by demographics, sort data, and export to Excel. We’ve also improved the survey experience for participants on both mobile and desktop. To read more about dropdown questions in reporting, click here.