![people element logooo.png]](https://20709424.hs-sites-na2.com/hs-fs/hubfs/people%20element%20logooo.png?height=50&name=people%20element%20logooo.png)
Before You Generate Analyst Insight
Analyst Insight uses the data currently selected in reporting. Before generating your analysis, review your data selection.
You can adjust:
- Survey
- Date range
- Demographic filters
- Key Groups
- Comparison survey, when applicable
There must be at least 10 participant responses in the selected data to generate Analyst Insight.
Your survey's existing minimum data thresholds also apply. Demographic results will only be included when the minimum number of responses required for that demographic item has been met.
Select Key Groups
Key Groups are demographic groups you want Analyst Insight to pay particular attention to when analyzing your results.
Key Groups are not a filter! They act as a guide for the AI model to know what data is most important to you.
The available Key Groups are based on the demographics available within your selected survey's data. Demographic groups that don't meet your survey's minimum data threshold will not be available for selection.
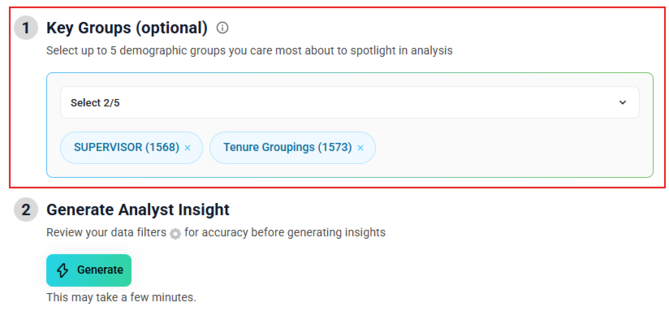
The number displayed next to each Key Group represents the number of responses with data available for that demographic.
You can select up to five Key Groups. Limiting the selection helps keep the analysis focused on the demographic breakouts most important to you.
You do not have to select any Key Groups - they are optional. If you generate Analyst Insight without Key Groups, the report will focus on aggregated results and will not include demographic breakouts or the Key Group Highlights section.
Change Your Key Groups
You can add or remove Key Groups at any time:
- Open Insight Settings.
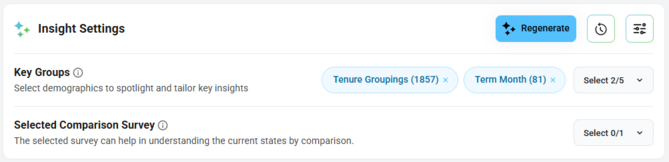
- Add or remove your Key Group selections.
- Select Regenerate to update the analysis.
Changing Key Groups does not automatically update an existing analysis. Analyst Insight must be regenerated to reflect your new selections by clicking 'Regenerate'.
How Comparisons Work
Analyst Insight uses comparison data differently depending on whether you're analyzing a point-in-time or always-on survey.
Point-in-Time Surveys
Point-in-time surveys have a defined response collection period, such as an annual Engagement survey.
For these surveys, AI will smart-select a comparative survey when one is available.
To review or change the comparison:
- Open Insight Settings.
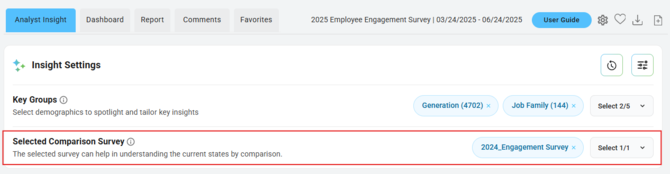
- Find the selected comparison survey.
- Keep the selected survey, remove it, or choose another available survey.
- Regenerate Analyst Insight if you make a change.
You can select one comparison survey.
Only eligible point-in-time surveys with sufficient data will appear as comparison options.
Always-On Surveys
Always-on surveys, such as Exit and Onboarding surveys, use the selected date range to create the comparison automatically rather than comparing against a separate survey.
Analyst Insight uses the midpoint of your selected date range to create a comparison. It compares results from the entire selected date range to results from the first half of that period to show how results have changed over time.
For example, if you select one year of Exit data, Analyst Insight compares the full year of results to the first six months.
Analyst Insight will analyze a maximum of two years of data for this comparison. Data beyond the two-year period is not included in the analysis.
Generate Your Analysis
Once you've confirmed your data, Key Groups, and comparison settings, select Generate.
Depending on the data available, Analyst Insight can include:
Executive Summary
Provides an overall summary of the selected survey data, including notable strengths and areas needing attention. It may also reference relevant open-ended comment themes.
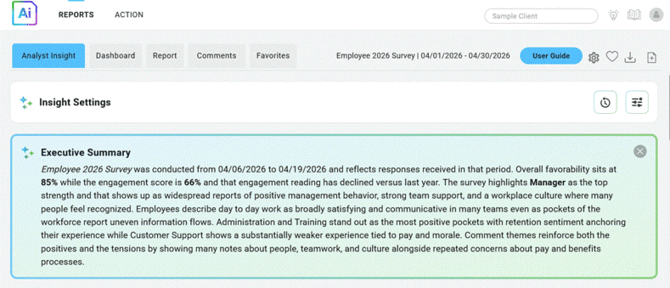
For point-in-time surveys, the Executive Summary displays the actual response collection dates, unless you've selected a shorter date range, in which case it reflects your selection. For always-on surveys, it reflects the date range selected in your data filters.
Metrics That Matter
Displays applicable metrics based on the questions included in your survey. These may include Engagement, eNPS, Intention to Stay, and, when applicable, Exit factors and rehire potential.
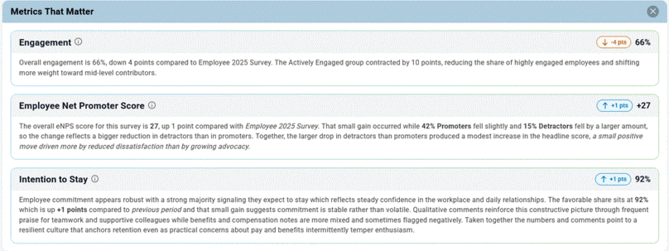
When comparison data and Key Groups are available, this section can also provide context about changes and demographic results.
The metrics displayed in this section depend on the questions included in your survey. The following metrics may appear when the corresponding questions are present:
- Engagement
Displays when all 6 engagement questions from the People Element question library are included in the survey. - Employee Net Promotor Score
Displays when either People Element library question, or a similarly worded custom question, is included:
- "I would recommend this organization as a good place to work” (1-5 scale)
- “How likely would you be to recommend the organization as a good place to work?” (1-10 scale)
- Intention to Stay
Displays when the People Element library question, or a similarly worded custom question, is included:
- "I plan to be here at least 1 year from now"
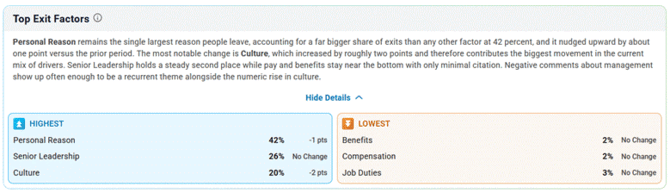
- Top Exit Factors
Displays when the People Element library question, or a similarly worded custom question, is included:
- "Please rate the following factors in terms of how much impact they had on your decision to leave the organization."
- Likelihood to Return
Displays when the People Element library question, or a similarly worded custom question, is included:
- "I would consider returning to the organization"

Key Trends
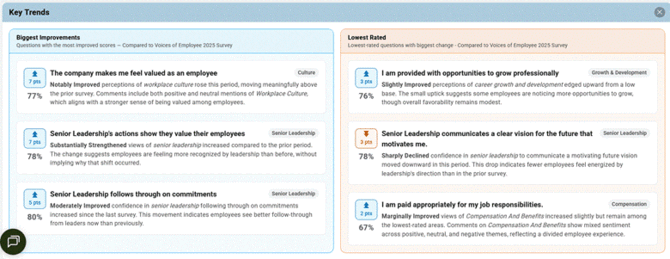
The items that moved the most — the questions with the largest positive change alongside the lowest-rated items and their movement — so you know what to celebrate and what is slipping. Key Trends requires a comparison survey: for point-in-time surveys you select a prior survey to compare against; for always-on programs, the full selected date range is compared to the first half of that period.
Key Group Highlights
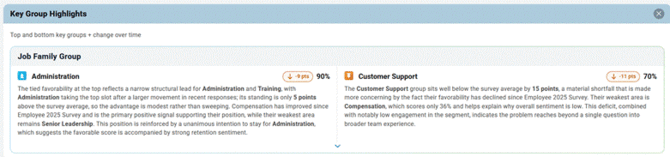
A closer read on the demographic groups you chose to spotlight — up to one card per Key Group. Each card shows the highest and lowest performing groups, how they have moved, and a short narrative of what is driving the experience, including themes pulled from open-ended comments. If no Key Groups are selected, this section does not appear.
Prioritized Focus Areas
Up to three areas most likely to move the needle — not simply the lowest scores. Powered by driver analysis specific to your survey type, it links correlational impact, sentiment, and comment themes to explain why each area matters, turning results into a clear set of priorities to act on.
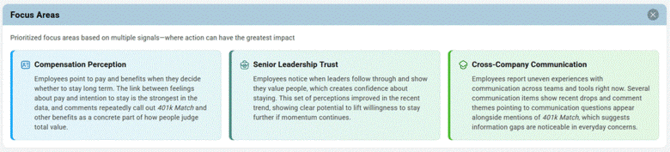
Focus Areas weigh three signals together to find where attention will matter most:
- Impact — how closely a topic is tied to overall engagement for your survey type. Some topics move the needle far more than others, so these carry more weight.
- Sentiment — how positive or negative employees feel about the topic, based on how they rated the related questions.
- Themes — what employees actually wrote about in their open comments, and how often a subject comes up.
Why it may not match your lowest number
Because impact is part of the equation, a very low score on a topic that has little bearing on engagement may not appear, while a mid-range score on a topic that strongly drives engagement might rise to the top. This is intentional: Focus Areas is designed to point you toward the changes most likely to lift engagement — not simply the smallest numbers on the page.
Changing Your Data After Generating Analyst Insight
You can change your data selection at any time, including:
- Selecting another survey
- Changing the date range
- Adding or removing demographic filters
- Changing Key Groups
- Changing or removing a comparison survey
Analyst Insight does not automatically change an existing report when you make these selections. The analysis must be regenerated.
If you change your survey or data filters elsewhere in reporting, such as the Dashboard or Comments, and then return to Analyst Insight, you may see:

Select Regenerate to create an analysis using your current data selection, or open a previously generated analysis from Recent Insights.
When you change Key Groups or your comparison survey directly from Insight Settings, use the Regenerate option that appears to apply those changes.
Viewing Recent Insights
Analyst Insight keeps up to 10 of your most recently generated reports available in Recent Insights.
To open a previous report:
- Open Insight Settings.
- Select the timer/history icon to open Recent Insights.
- Select the report you want to view.
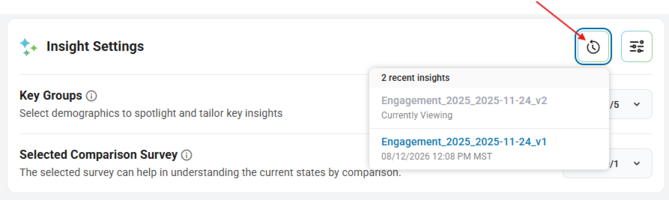
The report title identifies the survey, and the date and time indicate when that insight was originally generated.
You can also access Recent Insights by scrolling down the Analyst Insight page when prompted after changing your reporting data selection.
When Does New Survey Data Appear?
Previously generated Analyst Insight for surveys that are still collecting responses are updated once per day at 12 AM MST.
This applies to both:
- Always-on surveys that continue collecting responses
- Point-in-time surveys that are still within their response collection period
During the daily update, Analyst Insight checks for new response data and updates the 'Recent Insight' page to include the most recent available data.
Because this update occurs once daily, responses collected earlier in the day may not immediately appear in an existing or previously run Analyst Insight generation. An existing report cannot be manually forced to refresh before the next scheduled update.
Why don't I see responses collected today?
Analyst Insight refreshes preexisting insights once daily at 12 AM MST. If responses were collected after the most recent refresh, they may not appear until the next daily update.
Saving Analyst Insight
You can save an Analyst Insight report in two ways:
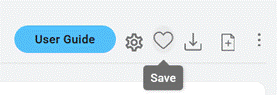
- Select the heart icon to save the Analyst Insight report currently in view.
- Add Analyst Insight to a Custom Report created from the Favorites area.
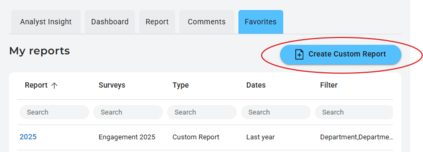
Saving allows you to return to the analysis without rebuilding the report selections. If you select one of our preset date ranges (e.g. Last month, Last 3 months, etc.), your data will automatically update on a daily basis as new data is available.
Analyst Insight can also be exported to PDF or PowerPoint, and you can choose which Analyst Insight sections to include in the export.